Best of Data VisualizationNovember 2024

  1. 1
    Article
    Avatar of cyberdevelopersCyber Devs·1y

    D3 / ThreeJS Network Topology Simulation

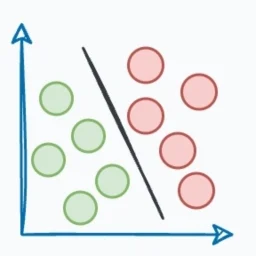
    Building a 3D Knowledge Graph for endpoint forensics can yield impressive results but organizing the endpoints clearly is challenging. Suggestions for clearer presentation methods, potentially using RTS game techniques or isometric gridding, are being sought.

  2. 2
    Article
    Avatar of metabaseMetabase·1y

    How to visualize time-series data: best practices

    Learn the best practices for visualizing time-series data, including selecting the right chart types and structuring your data for clear and impactful visualizations. Charts such as line, bar, area, trend, and waterfall are discussed, along with techniques like using offsets for comparisons. A time-series cheat sheet dashboard is also available for easy reference.

  3. 3
    Article
    Avatar of communityCommunity Picks·1y

    Piling.js

    Piling.js supports a variety of dynamic mouse interactions for managing groups of items in a visualization. Users can utilize drag and drop, multi-select, lasso, in-place browsing, preview browsing, dispersive browsing, hierarchical browsing, pile dispersion, and pile scaling to manipulate piles of data intuitively.

  4. 4
    Article
    Avatar of towardsdevTowards Dev·1y

    “Data-Driven Football Insights: From Web Scraping to Visualization Using Airflow, Dbt Cloud, and AWS Tech Stack”

    This project automates the process of collecting, storing, and analyzing football data using technologies like Apache Airflow, DBT Cloud, and AWS. The workflow includes web scraping data using Python, storing it in Amazon S3, processing it in Amazon Redshift, transforming data with DBT Cloud, and visualizing it through Amazon QuickSight. This integrated approach offers a scalable solution to manage and analyze detailed football statistics efficiently.

  5. 5
    Article
    Avatar of dailydoseofdsDaily Dose of Data Science | Avi Chawla | Substack·1y

    How to Create a Calendar Plot in Python?

    Calendar plots are an effective way to visualize day-to-day variations in data over a longer period, typically a year. Using the `calplot()` method from the Plotly library, you can easily create a calendar plot with just two lines of Python code. This plot type is particularly useful for detecting weekly or monthly seasonality in data and can often reveal insights that traditional plots or aggregation methods might miss.

  6. 6
    Article
    Avatar of hnHacker News·1y

    1 dataset. 100 visualizations.

    An information design agency aimed to create 100 different visualizations from a single dataset. Their goal was to demonstrate the variety and complexity possible in data visualization, highlighting how different techniques can tell unique stories with the same data.

  7. 7
    Article
    Avatar of tdsTowards Data Science·2y

    The Four Pillars of a Data Career

    Breaking into a data career typically requires proficiency in four pillars: spreadsheets (Excel), SQL, visualization tools (Tableau or Power BI), and scripting languages (Python or R). The post suggests focusing on Excel for entry-level roles, with additional recommendations for learning SQL basics, creating standard charts in visualization tools, and understanding programming essentials in scripting languages.

  8. 8
    Article
    Avatar of detlifeData Engineer Things·2y

    End-to-End ETL and Sales Dashboard Project in Microsoft Fabric

    A step-by-step guide on creating a sales dashboard using Microsoft Fabric and PowerBI Desktop for the WideWorldImporters sample database. Key goals include creating a dynamic and user-friendly interface for monitoring sales performance across various dimensions like customer, product, and region. The post covers data gathering, ETL processes, creating views and tables, setting up a semantic model, and building various visuals to support different user stories.