JavaScript Debugging with VS Code and Chrome Debugging is a vital part of identifying why your application is misbehaving. This article will discuss how we can debug JavaScript using the simple and efficient tools in Visual Studio Code and Google Chrome. A list of breakpoints is always available in the right panel of Chrome DevTools. For example, JavaScript will throw an error in strict mode if we assign values to undeclared variables.
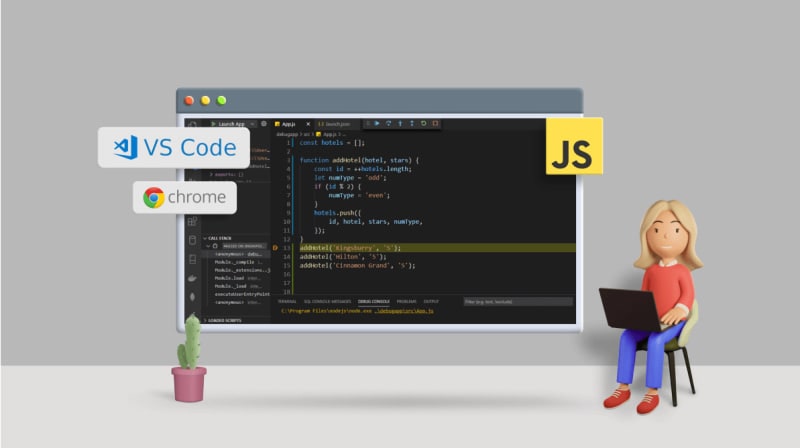
Table of contents
Debugging Methods for JavaScriptDebugging JavaScript in VS CodeDebugging JavaScript with Google ChromeBenefits of Having a Debugger ToolWrap UpRelated blogs1 Comment
Sort: