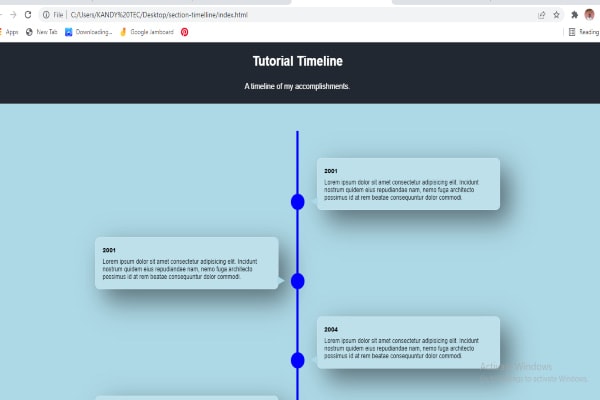
This article will use HTML5 , CSS3 (glassmorphism implementation), and Vanilla JavaScript to create a vertical timeline chart. The chart will display various events vertically aligned in a card-like layout. Event cards at odd number positions are placed on the right side of the vertical line, and those at even number positions on the left side. Each event card is alternatively displayed in opposite positions.
1 Comment
Sort: